
Key highlights
- Learn how traceroute maps the exact network path your data travels and pinpoints where connectivity issues occur.
- Running traceroute commands across Windows, macOS and Linux operating systems
- Explore how traceroute works behind the scenes using hops, TTL values and multiple probes to map network routes.
- Master traceroute output interpretation and troubleshoot network issues, including latency spikes, timeouts and routing problems.
- Understand traceroute best practices and command options to diagnose slow websites, ISP connectivity issues and hosting performance problems with confidence.
When your connection is slow or unstable, the issue often lies somewhere along the network path between your device and the destination server. The traceroute command is a powerful network diagnostic tool that helps you pinpoint exactly where connectivity problems occur by mapping the complete route your data takes across the internet.
By running traceroute (or tracert on Windows systems), you can identify network bottlenecks, routing issues and points of failure that impact your website’s performance or application connectivity.
This comprehensive guide covers everything you need to know about the traceroute command—from understanding what traceroute is and how it works, to running traceroute on Windows, Mac and Linux systems. You’ll master traceroute output interpretation, analyze network routing paths hop by hop and learn to leverage traceroute alongside other network diagnostic tools to troubleshoot and resolve connectivity problems efficiently.
What is traceroute and what does it actually do?
Traceroute is a network diagnostic command that shows the path your data takes from your device to a destination, such as a website or server. Instead of checking just one connection, traceroute traces the entire route hop by hop, revealing each network device your request passes through on the way.
When you run a traceroute, it sends small packets toward the destination and waits for responses from routers along the path. Each router that responds is listed as a “hop,” along with the time it took for the packet to reach that point and come back. This helps you see not only where your traffic is going, but also how long it takes at each step.
What traceroute diagnostic command helps you troubleshoot and understand:
- Where does the connection start slowing down?
- At which point does the request stop responding?
- Is the problem happening on my network, my ISP or closer to the server?
On Windows systems, the traceroute command is called tracert, but both tools serve the same diagnostic purpose. While traceroute doesn’t directly resolve network connectivity problems, it provides essential diagnostic information that pinpoints exactly where network issues occur along the data path. This targeted insight can significantly reduce troubleshooting time and help network administrators quickly identify whether problems stem from your local connection, your ISP or the destination server.
How does traceroute work?
At a basic level, traceroute works by sending packets toward a destination and forcing the network to reveal each step along the way. Instead of waiting for the packet to reach the final server directly, traceroute intentionally limits how far each packet can travel. This is what allows it to map the path one hop at a time.
The traceroute command works by manipulating packet Time-to-Live (TTL) values and interpreting the ICMP error messages routers send back. Every ICMP ‘Time Exceeded’ response traceroute receives reveals how many hops the packet completed, allowing the tool to reconstruct the full network path one router at a time, even though the original packets sent may be UDP, ICMP or TCP, depending on the operating system. While TTL manipulation and ICMP protocols power the process, the core principle behind traceroute is surprisingly simple and easy to grasp.
1. Understanding hops in traceroute
When you run a traceroute command, each hop represents an intermediate network device—such as a router or gateway—that forwards your data packet closer to its final destination. As your packet travels through the network infrastructure, it passes through these devices sequentially and each transition between devices is recorded as one hop in your traceroute output, helping you visualize the complete routing path from source to destination.
So when you see hop 1, hop 2, hop 3 and so on in traceroute output, you’re basically looking at the path your traffic takes as it moves across local routers, your ISP’s network and eventually toward the destination server.
Some hops are close to you, like your home router or ISP gateway, while others may be located in different cities or even countries.
2. The role of TTL in traceroute
TTL stands for Time To Live and it’s the key mechanism that makes traceroute possible. Each packet sent by traceroute includes a TTL value that limits how many hops it’s allowed to pass through before being discarded.
Traceroute starts by sending a packet with a TTL of 1. This packet expires at the first router, which then sends a response back saying the packet’s limit was reached. Traceroute records that response and moves on. Next, it sends another packet with a TTL of 2, allowing it to reach the second hop before expiring.
By increasing the TTL one step at a time, traceroute gradually uncovers each hop along the route until the packet finally reaches the destination. This step-by-step approach is what lets traceroute map the full network path instead of jumping straight to the end.
3. Why traceroute sends multiple probes
If you’ve ever noticed that traceroute shows three time values for each hop, that’s because it sends multiple probes, usually three, to the same hop. This helps account for small timing variations and network congestion.
Networks don’t always behave consistently. One packet might take slightly longer than the next or a router might delay a response under load. By sending multiple probes, traceroute gives you a more reliable picture of how that hop is behaving, rather than relying on a single data point.
When those time values are similar, the hop is generally stable. If they vary a lot, it can indicate congestion or prioritization differences.
How to run traceroute on different operating systems?
Running traceroute isn’t complicated, but it does depend on what operating system you’re using. The command itself is basically the same idea everywhere, you just run it from a different place and sometimes under a different name.
Once you know where to type it, traceroute becomes one of those tools you keep coming back to whenever something feels “off” with a connection.
1. Running traceroute on Windows
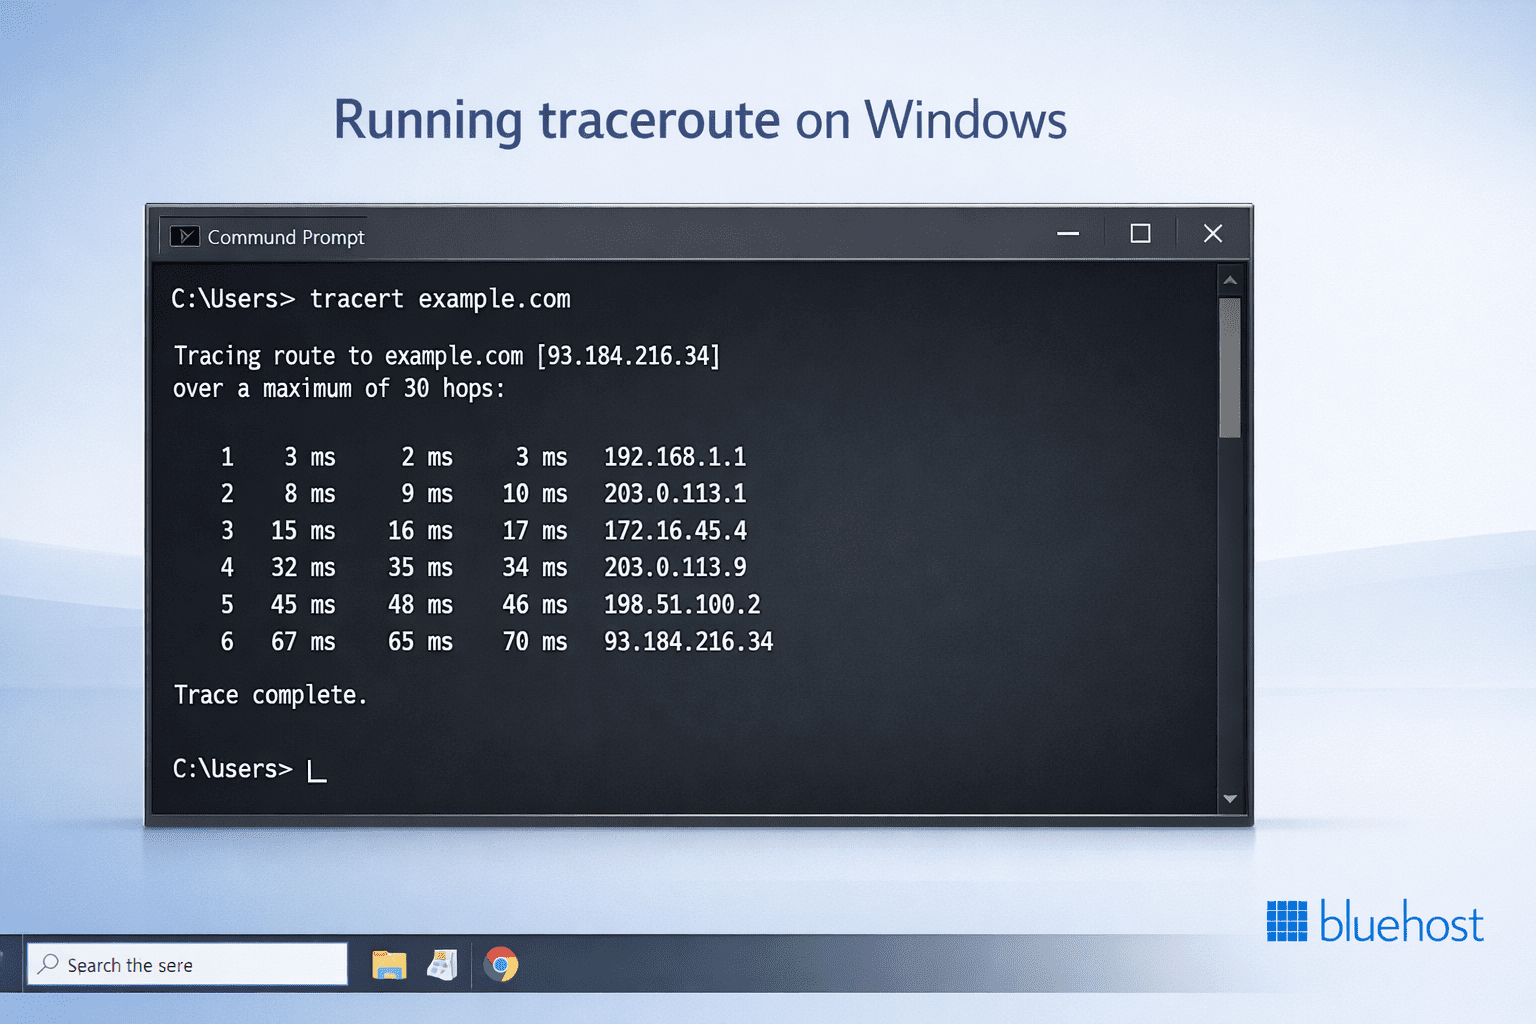
On Windows, traceroute goes by the name tracert and it’s already built in, so there’s nothing extra to install.
Open Command Prompt (you can press Windows + R, type cmd and hit Enter), then run:
tracert example.comAfter you press Enter, Windows will start listing out each hop between your computer and the destination. You’ll usually see three timing values per hop and the trace will keep going until it reaches the final server or times out.
If the output feels slow or messy, you can skip DNS lookups to make it run a little faster:
tracert -d example.comThis won’t change the route itself, it just avoids translating IP addresses into names, which can slow things down sometimes.
2. Running traceroute on macOS
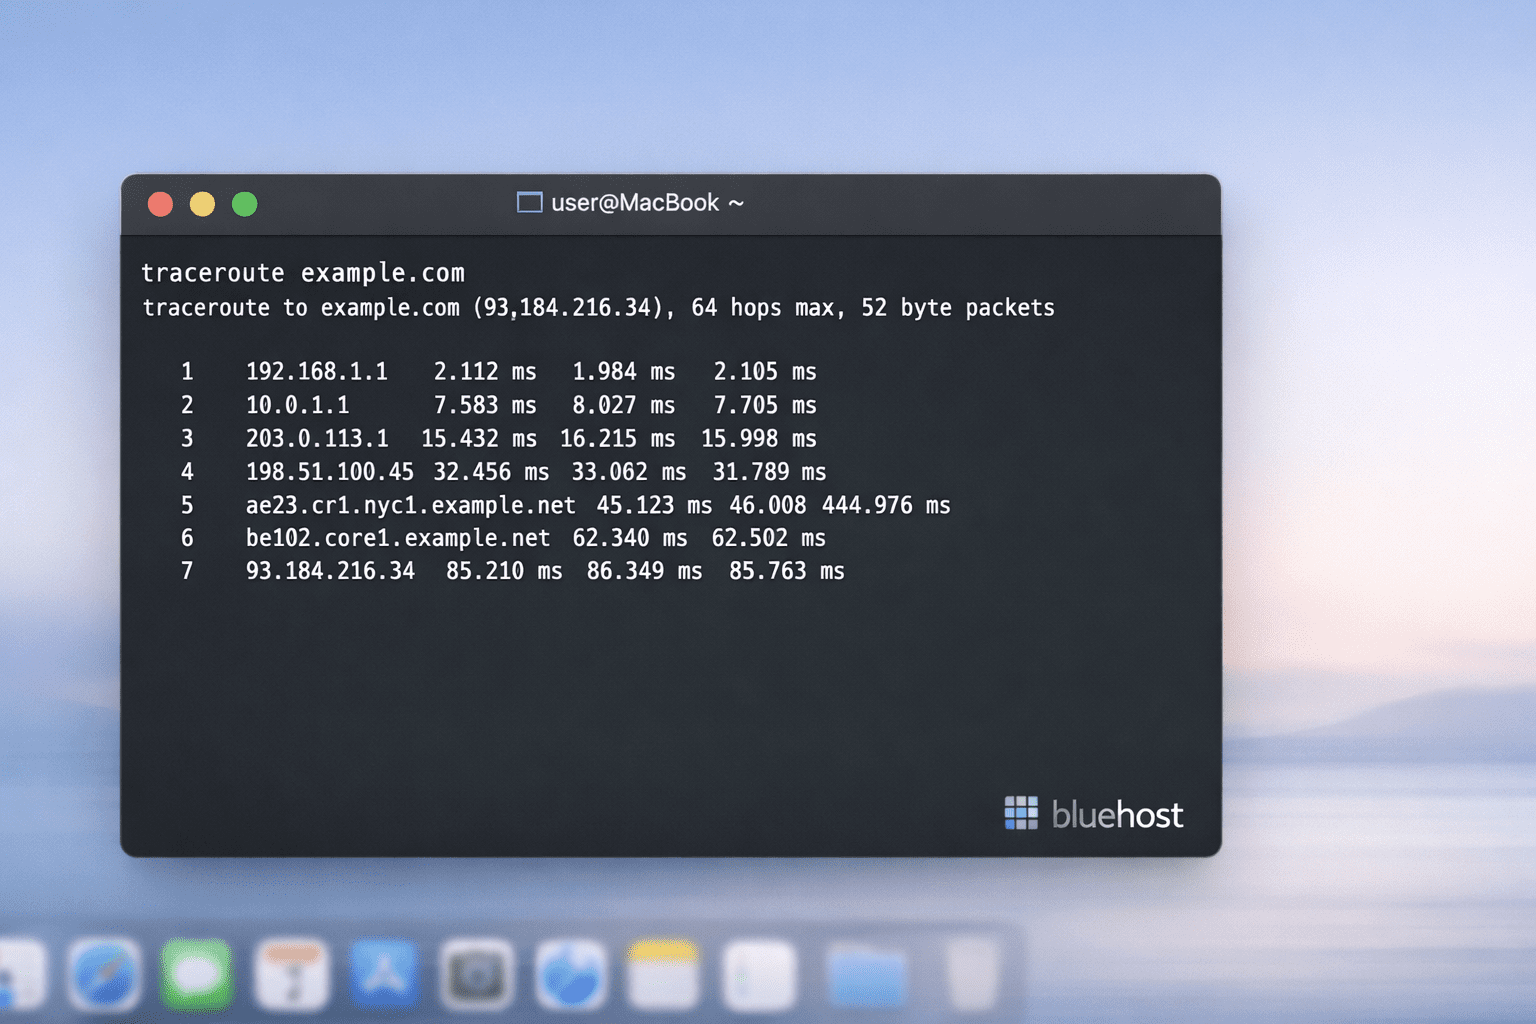
On macOS, you run traceroute from the Terminal app. If you don’t use Terminal often, just open Spotlight, type “Terminal,” and open it from there.
Then run:
traceroute example.comYou’ll start seeing hops appear one by one. On some networks, the trace might pause for a bit or look like it’s stuck, but that’s usually just a router not responding quickly, not something broken on your Mac.
According to Datadog, Linux and macOS traceroute use UDP by default while Windows tracert uses ICMP, which leads to some implementation differences even though the core goal is the same.
3. Running traceroute on Linux
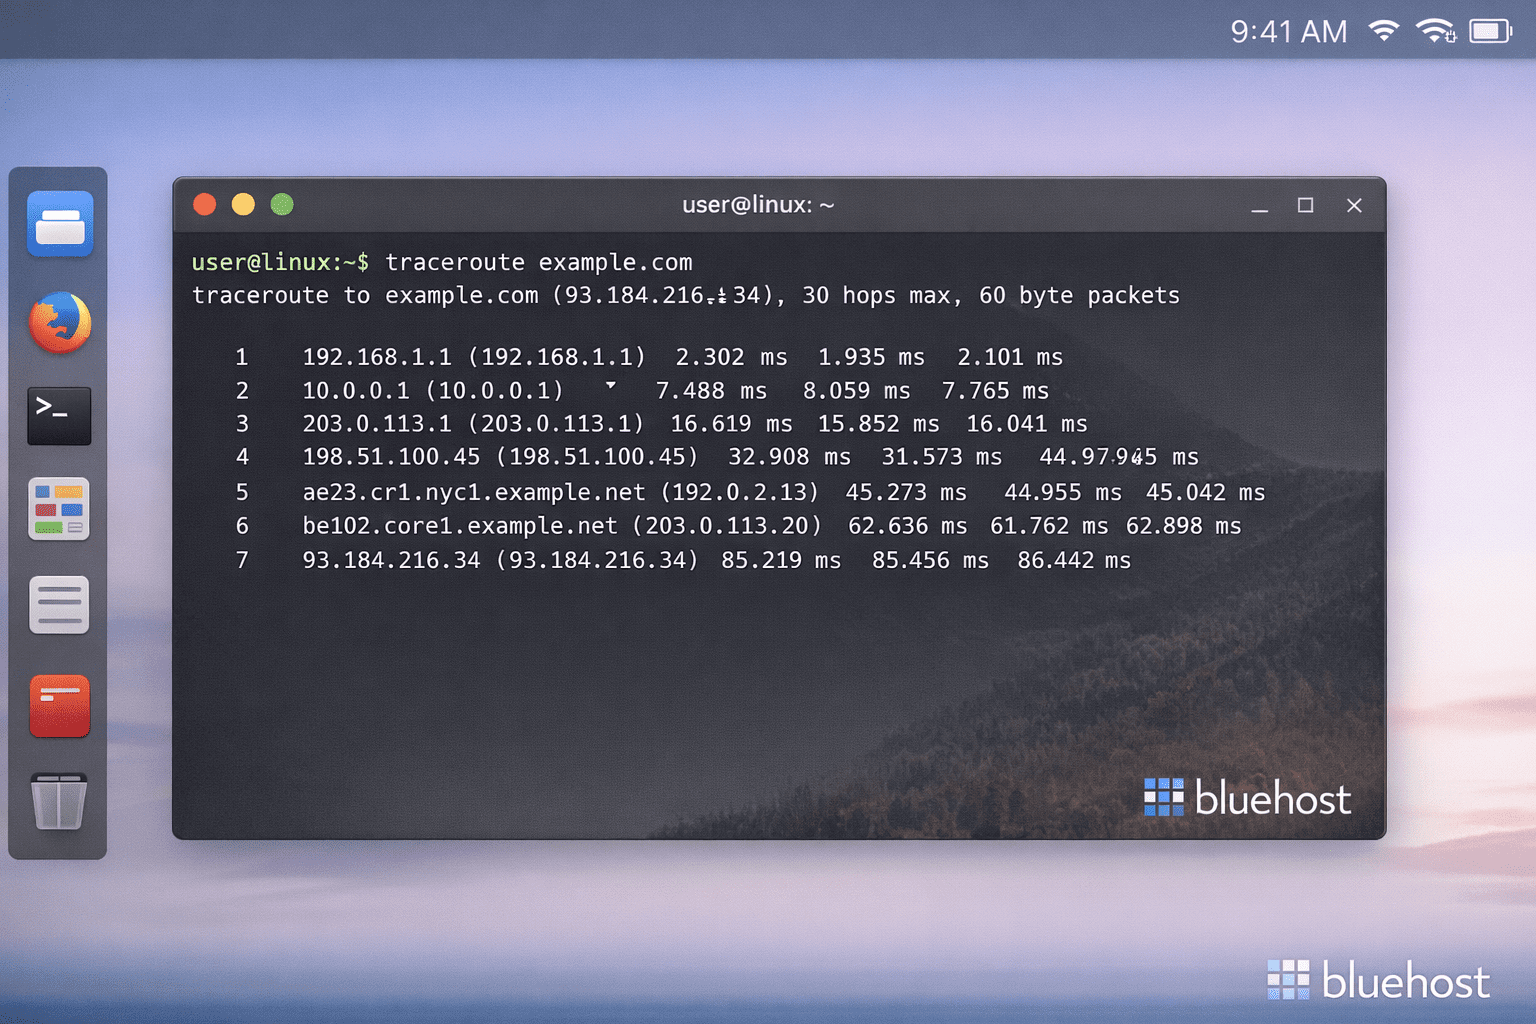
On Linux, traceroute works very much like it does on macOS. The only catch is that it might not be installed by default, and on some Linux distributions, it may require root or sudo privileges because it uses raw sockets.
If it is installed, you can just run:
traceroute example.comIf you see a “command not found” message, you’ll need to install it first. For example, on Ubuntu or Debian:
sudo apt install tracerouteOnce it’s installed, running traceroute will give you the hop-by-hop path to the destination. A lot of Linux users tweak traceroute with extra flags, but honestly, the basic command is usually enough to figure out where a connection starts acting weird.
Common traceroute command options worth knowing
You don’t need to memorize a bunch of traceroute flags to make it useful. In fact, most of the time the basic command works just fine. That said, there are a few options that come up again and again, especially when a trace feels slow or the results are confusing.
These are the ones worth knowing, even if you only use traceroute once in a while.
1. Running traceroute by skipping DNS lookup
By default, traceroute tries to resolve every IP address it sees into a hostname. That sounds helpful, but it can slow things down, especially on unstable networks or when DNS itself is part of the problem.
Skipping DNS lookups makes traceroute run faster and keeps the output cleaner.
On Windows, you can do this with:
tracert -d example.comOn macOS and Linux:
traceroute -n example.comYou’ll see IP addresses instead of hostnames, which is usually fine when you’re just trying to spot where delays or failures start. If you really need the names later, you can always run a second trace.
2. Setting max hops and timeout values
Sometimes traceroute keeps going longer than you expect or waits too long on a hop that clearly isn’t responding. In those cases, limiting how far or how long it tries can save time.
To limit the number of hops:
Windows:
tracert -h 15 example.commacOS/Linux:
traceroute -m 15 example.comYou can also adjust how long traceroute waits for a response from each hop. This is useful on slow links or high-latency networks.
On Windows:
tracert -w 500 example.comThese tweaks don’t change the route itself; they just control how patient traceroute is while waiting for replies.
3. Forcing IPv4 or IPv6 routes
On systems that support both IPv4 and IPv6, traceroute might choose one automatically. Most of the time that’s fine, but when something is broken, it helps to test each one separately.
On Windows:
Force IPv4: tracert -4 example.com
Force IPv6: tracert -6 example.com
On macOS and Linux:
IPv4: traceroute -4 example.com
IPv6: traceroute -6 example.com
If one version works and the other fails, you’ve already narrowed the problem down a lot. This is especially helpful when dealing with ISPs, VPNs or newer networks where IPv6 isn’t always configured properly.
How to read traceroute results correctly?
Running traceroute is the easy part. The confusing part is staring at the output and figuring out what actually matters. At first glance, traceroute results can look noisy or even a bit scary, but once you know what to focus on, they start to make sense.
The key is not to overanalyze every line. You’re mostly looking for patterns, sudden changes or where things stop responding.
1. Reading hop numbers and response times
Understanding traceroute output becomes straightforward once you learn how each hop in the result represents a network checkpoint, with every line revealing timing details and router information along the path to your destination.
- Hop number: the order in which your traffic moves through the network
- Hostname: a readable name for the router (may be missing or generic)
- IP address: the actual network identifier for the hop
- Response times (ms): how long it took for the packet to reach the hop and return
The hop number tells you where you are in the route, the IP address tells you which device you’re hitting and the response times give you a rough idea of how fast or slow that part of the path is.
The hop numbers should increase steadily as the trace moves away from your device, which helps you understand how far along the route you are. IP addresses are usually more reliable than hostnames, since hostnames can be missing, outdated or misleading. Response times also don’t need to be perfectly consistent to be normal. Small jumps or uneven numbers are common and only repeated or sustained increases usually point to an actual problem.
2. What the three response times mean
Traceroute usually shows three time values for each hop, which can be confusing at first. These numbers represent separate attempts to reach the same hop, not three different routes.
- Each value is a round-trip time for one probe
- All three probes are sent to the same hop
- The times are measured in milliseconds (ms)
These multiple probes help show how stable or unstable a hop is. If all three values are close, that hop is responding consistently. If one value is much higher than the others, it could be due to temporary congestion or packet prioritization.
Response times don’t need to match exactly to be considered normal. What matters more is whether high latency appears repeatedly and continues across multiple hops rather than showing up once and disappearing on the next line.
3. Finding where the issue begins
When you’re troubleshooting with traceroute, the goal isn’t to analyze every hop in detail. You’re mostly trying to find the point where things start to change.
- Look for the first hop where latency increases noticeably
- Check if the higher latency continues on following hops
- Note where the trace stops if it never reaches the destination
If latency jumps at one hop and stays high for all subsequent hops, that hop is often where the issue begins. On the other hand, if one hop looks slow but the next hop returns to normal response times, the slow hop is usually not the real problem.
If traceroute stops completely before reaching the destination, it may point to filtering, routing issues or firewall rules along the path. Stopping closer to the destination often suggests server-side or hosting-level restrictions rather than a local network issue.
Example: analyzing traceroute results
Here’s a typical traceroute output that shows both normal behavior and potential issues:
tracert [example].com
1    2ms    1ms    2ms    192.168.1.1
2    15ms   12ms   18ms   10.0.0.1
3    25ms   22ms   28ms   203.0.113.1
4    180ms  175ms  185ms  203.0.113.10
5    182ms  178ms  190ms  203.0.113.15
6    *      *      *      Request timed out
7    185ms  180ms  192ms  203.0.113.20
Notice that hops 1-3 show normal latency progression (under 30ms). At hop 4, latency jumps dramatically to around 180ms and stays high through hop 5, indicating the issue likely starts at hop 4.
The timeout at hop 6 doesn’t propagate since hop 7 responds normally, suggesting that the router simply doesn’t reply to traceroute probes rather than blocking traffic. If you see this pattern consistently across multiple runs, document the hop numbers and latency spikes when contacting your ISP or hosting provider for troubleshooting.
Common traceroute issues and what they usually indicate
Traceroute rarely gives you a clean yes-or-no answer. Instead, it shows patterns. Once you recognize those patterns, it becomes much easier to tell whether you’re dealing with a real network issue or just noisy output.
Below are some common traceroute results and how to think about them.
1. Sudden increase in latency
A sudden jump in response time often stands out in traceroute results. When latency increases sharply at one hop and stays high for every hop after it, that hop is usually where the problem begins. This can happen due to congestion, routing changes or an overloaded network segment.
However, if a single hop shows high latency but the next hop returns to normal response times, the slow hop is usually not the real issue. Some routers respond slowly to traceroute probes even though they forward traffic without any trouble.
What to do next: Run traceroute a few times to see if the pattern is consistent. If the latency jump keeps appearing at the same hop, note that hop and share the results with your ISP or hosting provider when reporting the issue.
2. Traceroute stops before reaching destination
In some cases, traceroute may stop responding partway through the route and show timeouts instead of results. This doesn’t automatically mean that traffic is blocked or the destination is unreachable.
Many networks limit or block traceroute and ICMP responses for security reasons, especially closer to the destination. If the trace stops early in the route, it may point to a local network or ISP-level issue. If it stops near the end, it’s more likely related to firewall rules or filtering on the destination network.
What to do next: Try running traceroute from another network or without a VPN to compare results. If the trace consistently stops at the same point, include that information when contacting support.
3. Traceroute completes but the website is still slow
Sometimes traceroute reaches the destination without any obvious issues, but the website or app still feels slow. When this happens, the problem is usually not with basic routing.
Traceroute only shows the network path, not what happens after the connection is established. Server load, application performance, DNS resolution or content delivery issues can all cause slowness even when traceroute looks clean.
What to do next: Use traceroute alongside other tools like ping, page load tests or server monitoring. A clean traceroute is still useful; it just means you may need to look beyond the network path.
Also read: What Are DNS Records? Types, How They Work & How to Update Them
4. Load balancing and traceroute
When websites use load balancing or CDN services, traceroute results can appear inconsistent, showing different IP addresses or paths between individual probes or repeated runs. This happens because traffic gets distributed across multiple servers or network paths automatically, which is actually normal behavior for modern web infrastructure.
Each probe might reach a different server in the load balancer pool, making the route appear to change even when everything is working correctly.
What to do next: To distinguish between normal load-balancing behavior and actual problems, run traceroute multiple times and look for patterns. Test both the hostname and its direct IP address to see if routing differs. If you notice persistent latency increases that affect multiple downstream hops consistently across runs, that often indicates a genuine network issue rather than normal load balancing.
When traceroute points to consistent latency spikes or routing issues near the destination, it’s often a sign the problem isn’t on your device at all. It could be your hosting network, server resources or the way traffic is being routed to your site.
If you’re running a WordPress site and you want a hosting setup that’s built for stability and speed, it helps to start with a platform that’s optimized for WordPress from day one. Bluehost WordPress hosting is designed for WordPress performance through a reliable hosting architecture, scalability features, multi-layer caching and built-in Cloudflare CDN integration. It gives you a reliable foundation, so you can reduce recurring performance issues and spend less time troubleshooting.
Traceroute vs ping: when to use which?
Ping and traceroute are often mentioned together and for good reason. They both help you understand connectivity problems, but they answer different questions. Ping tells you if something is reachable, while traceroute helps explain why it might not be working as expected.
| Tool | What it tells you | Best used when | What it doesn’t show |
|---|---|---|---|
| Ping | Whether a host is reachable and basic response time | You want a quick connectivity check | Where the delay or failure is happening |
| Traceroute | The full network path and latency at each hop | You need to find where a problem starts | Application-level or server-side issues |
| Ping + Traceroute | Status plus path visibility | Troubleshooting slow or failing connections | Exact cause without further context |
Using them together usually gives a much clearer picture than relying on either one alone.
Why ping alone is not enough?
Ping is great for quick checks. It tells you whether a server responds and how long it takes for a packet to travel back and forth. But that’s also where its usefulness ends.
If ping shows high latency or packet loss, it doesn’t tell you where the problem is happening. The delay could be on your local network, inside your ISP or somewhere closer to the destination. Ping also doesn’t help much when a connection fails, since all you see is a timeout.
Also read: How to Use Ping Command (Windows, Mac, Linux Guide)
How traceroute complements ping results?
Instead of giving you a single result, traceroute shows the entire path your traffic takes and how each hop responds along the way.
When ping results look bad, traceroute helps narrow things down by showing which part of the route is slow or unresponsive. If ping works but feels inconsistent, traceroute can reveal routing changes or congestion along the path. And if ping fails completely, traceroute can often show how far the traffic gets before it stops.
Used together, ping gives you a quick status check and traceroute provides the context you need to understand what’s actually going on.
Best practices for accurate traceroute testing
Traceroute is a useful tool, but it’s easy to misread results if you only run it once or test under the wrong conditions. A few small habits can make your traceroute results much more reliable and easier to trust.
You don’t need to do all of these every time, but they’re good to keep in mind when you’re troubleshooting something that really matters.
1. Run traceroute multiple times
Network conditions change all the time. A single traceroute run might catch a temporary spike or a momentary delay that isn’t really a problem.
Running traceroute two or three times helps you see what’s consistent and what’s just noise. If the same hop keeps showing high latency or timeouts across multiple runs, that’s usually worth paying attention to. If the issue moves around or disappears, it was probably temporary.
2. Test with and without VPN
VPNs change your network path, sometimes in big ways. If you’re connected to a VPN, your traffic may be routed through a completely different location before heading to the destination.
If you’re seeing strange traceroute results, try running the test once with the VPN enabled and once without it. If the results look very different, the VPN may be part of the issue. This is especially common when websites work fine without a VPN but slow down or fail when it’s turned on.
Also read: What Are the Benefits of VPN? How VPNs Protect You | Bluehost
3. Always test both hostname and IP
Testing only the hostname doesn’t always tell the full story. DNS resolution, load balancing or CDNs can all affect which server you end up reaching.
Running traceroute once using the hostname and once using the direct IP address helps separate DNS-related issues from routing problems. If the IP trace works fine but the hostname trace doesn’t, DNS or traffic routing through a CDN may be involved.
Even when traceroute looks fine, you can still have a slow website because performance isn’t only about the network path. Heavy pages, unoptimized images, messy plugins and SEO issues can all create “slow site” symptoms that look like a hosting or ISP problem at first.
Bluehost SEO Checker helps identify common SEO and site-level issues that can impact performance. It enables you to identify what’s holding your site back and what you can improve next without guessing.
Final thoughts
Most network issues feel confusing because you can’t see what’s happening behind the scenes. Traceroute changes that by giving you a clear view of the path your data takes and how each part of the journey behaves.
Sometimes the issue isn’t your device or even your ISP. If the route looks clean until the final few hops or latency spikes right near the destination, that can point to hosting resources, server load or network routing around the host. And if you’re running a website, having a reliable hosting foundation matters just as much as good troubleshooting. Bluehost Web Hosting gives your site a stable, performance-ready home so you spend less time chasing connection issues and more time actually building.
Get started with Bluehost WordPress hosting built for speed, stability and performance you can rely on.
FAQs
Ping checks whether a server is reachable and how long it takes to respond, but it doesn’t show where delays occur. Traceroute goes a step further by displaying the full network path and each hop along the way. When a website feels slow or unstable, traceroute helps identify where the issue starts.
Tracert and traceroute perform the same function but are used on different systems. Tracert is the Windows version, while traceroute is used on macOS and Linux. The output may look slightly different, but both commands trace the path packets take across the network.
Traceroute is commonly used to troubleshoot slow websites, connection drops and routing issues. It helps identify whether a problem is happening on your local network, with your ISP or closer to the hosting server. While it doesn’t fix issues directly, it provides valuable insight into where delays or failures begin.
Asterisks usually mean a router did not respond to traceroute probes, not that traffic is blocked. Many networks limit or filter diagnostic traffic for security reasons. If traceroute still reaches the destination, occasional timeouts are usually not a problem.


Write A Comment