
Key highlights
- Understand what raw access and raw access logs contain (and how they differ from error logs).
- Follow a practical, step-by-step process for how to access cPanel on Bluehost and download logs safely.
- Learn how cPanel stores, compresses and rotates logs to manage disk usage.
- Identify SEO crawl behavior, 404 sources, performance bottlenecks and security threats from request patterns.
- Use faster analysis tools (CLI and desktop) while maintaining compliance and privacy.
When a website slows down, throws unexpected errors or suddenly loses organic traffic, the fastest way to move from guessing to knowing is to inspect your cPanel access log. Raw access logs record every HTTP request hitting your site, bots, real users, broken links and suspicious scans, so you can validate what is happening on the server instead of relying only on analytics tools.
This guide explains what raw access logs are, why they matter for SEO and security and exactly how to download and work with them in cPanel (including a step-by-step walkthrough for Bluehost). You will also learn how log rotation works, where the cPanel logs are typically located and what to look for when analyzing requests.
What are raw access logs?
Raw access logs are server-generated text files that document every single request made to your website. In cPanel, the “Raw Access” feature (found under the Metrics section) typically provides these records as downloadable archives for each domain and subdomain.
Most access logs adhere to a standard structure, such as the “Combined” log format, which generally includes the following details for each visitor interaction:
- Client IP address (or the proxy address, if applicable)
- Date and timestamp of the request
- HTTP method and the requested path (e.g., GET /products)
- Status code returned by the server (such as 200, 301, 404 or 500)
- Size of the data transferred (in bytes)
- Referrer URL (identifying where the visit originated)
- User-Agent string (identifying the browser, device or bot)
Raw access logs vs. other cPanel logs
In support discussions, you may hear the broad term “cPanel logs.” However, it is important to distinguish between the specific types of logs available on your server:
- Access logs: Record who requested what content, when it occurred and the resulting status code.
- Error logs: Document server-side failures, including PHP fatal errors, permission conflicts and misconfigurations.
- Audit logs: Track authentication events, firewall blocks and system-level actions (note that these are often not fully accessible in shared hosting environments).
Understanding the “raw access” feature in cPanel
The “Raw Access” interface in cPanel is designed primarily for convenience and archiving. It packages your domain’s access history into downloadable files, which are often compressed (e.g., .gz format). Unlike a real-time traffic monitor, this tool provides “exportable evidence” that you can save locally and analyze to investigate traffic patterns or security incidents.
Now that you understand what raw access logs are and how they differ from other log types in cPanel, let’s explore why regularly monitoring these logs is crucial for your website’s success.
Why you should monitor raw access logs (SEO, errors and security)
Monitoring your cPanel access log is not just a habit for developers; it is a critical discipline for effective website management. While standard analytics tools track visitor trends, raw access logs reveal the server-side reality, exposing hidden errors, crawler behavior and security threats that other platforms often miss or filter out.
1. Fix website errors faster (404s, redirect loops, broken assets)
Regularly reviewing your access logs allows you to pinpoint technical issues that impact user experience, such as:
- 404 error spikes following a redesign or migration (indicating missing pages, images or JavaScript files).
- Redirect chains (e.g., 301 → 302 → 301) that waste crawl budget and increase page load times.
- Hotlinking, where third-party sites drain your server resources by directly embedding your large assets.
For example, if you observe thousands of 404 requests targeting /wp-admin-ajax.php or discontinued product URLs, you can immediately determine whether to restore the missing resources, set up redirects or block the malicious traffic.
2. Support SEO & crawling insights (bots, crawl budget, referrers)
Access logs provide the most reliable data regarding how search engine bots interact with your website. They help you answer critical SEO questions, including:
- Is Googlebot successfully reaching your priority pages and returning a 200 OK status?
- Are key pages returning status codes like 304 (Cached), 403 (Blocked) or 5xx (Server Error)?
- Are bots wasting their crawl budget on URL parameters or low-value endpoints?
These logs also assist in reconciling traffic attribution. While analytics reports may display referrers as [anonymized by google] due to privacy reporting constraints, access logs capture the raw HTTP referrer header exactly as it is sent.
3. Improve security (credential stuffing, scanners, DDoS patterns)
Even small websites frequently face automated probing, such as requests for known vulnerable paths, repeated login attempts or unusual traffic bursts from specific IP ranges. Analyzing raw access logs helps you:
- Detect brute-force attacks (indicated by a high volume of requests to login endpoints).
- Identify and block suspicious user-agents and vulnerability scanners.
- Confirm if firewall rules are effective (e.g., verifying that blocked requests return a 403 response).
- Document security incidents effectively for support escalation.
Now that you understand why monitoring raw access logs is critical for your website’s health, let’s walk through how to access and configure these logs in your cPanel account.
How to access cPanel raw access logs in Bluehost (step-by-step)
If you are hosted on Bluehost and use cPanel, the Raw Access tool is typically the quickest way to download your logs for offline review. The steps below match the usual cPanel workflow and are useful if you are searching specifically for how to access cPanel on Bluehost.
1. Log in to your Bluehost Account Manager.
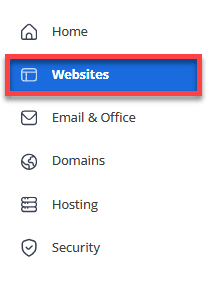
2. Navigate to the left-hand menu and click the Websites tab.
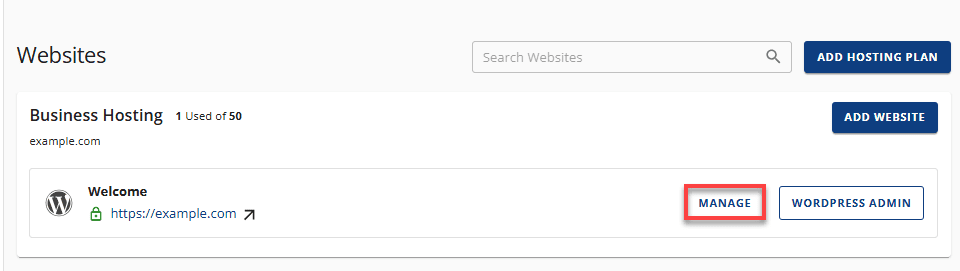
3. Find the site you wish to access and click the MANAGE button next to it.
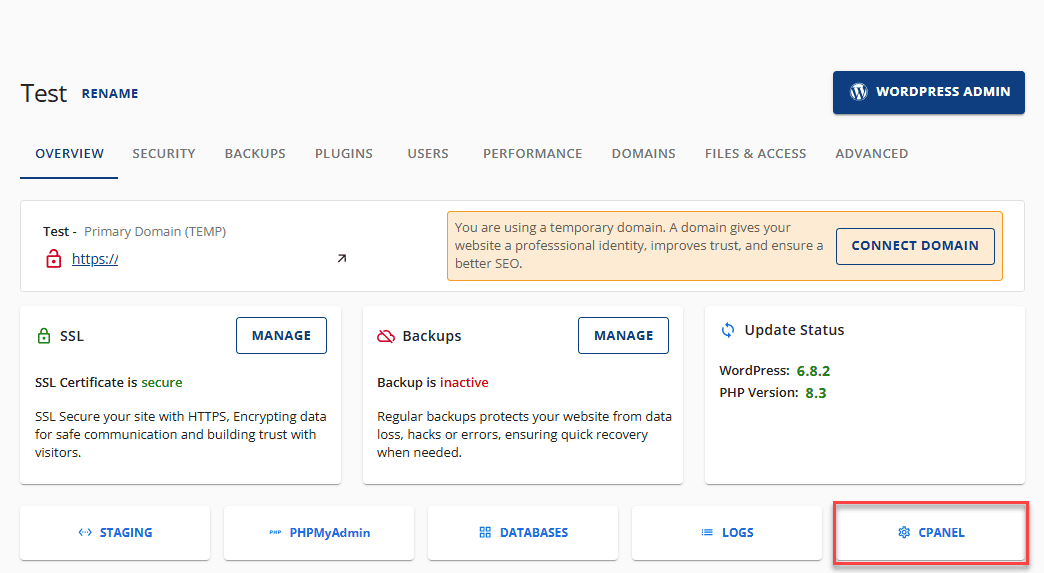
4. Locate the Overview section and click the cPanel button.
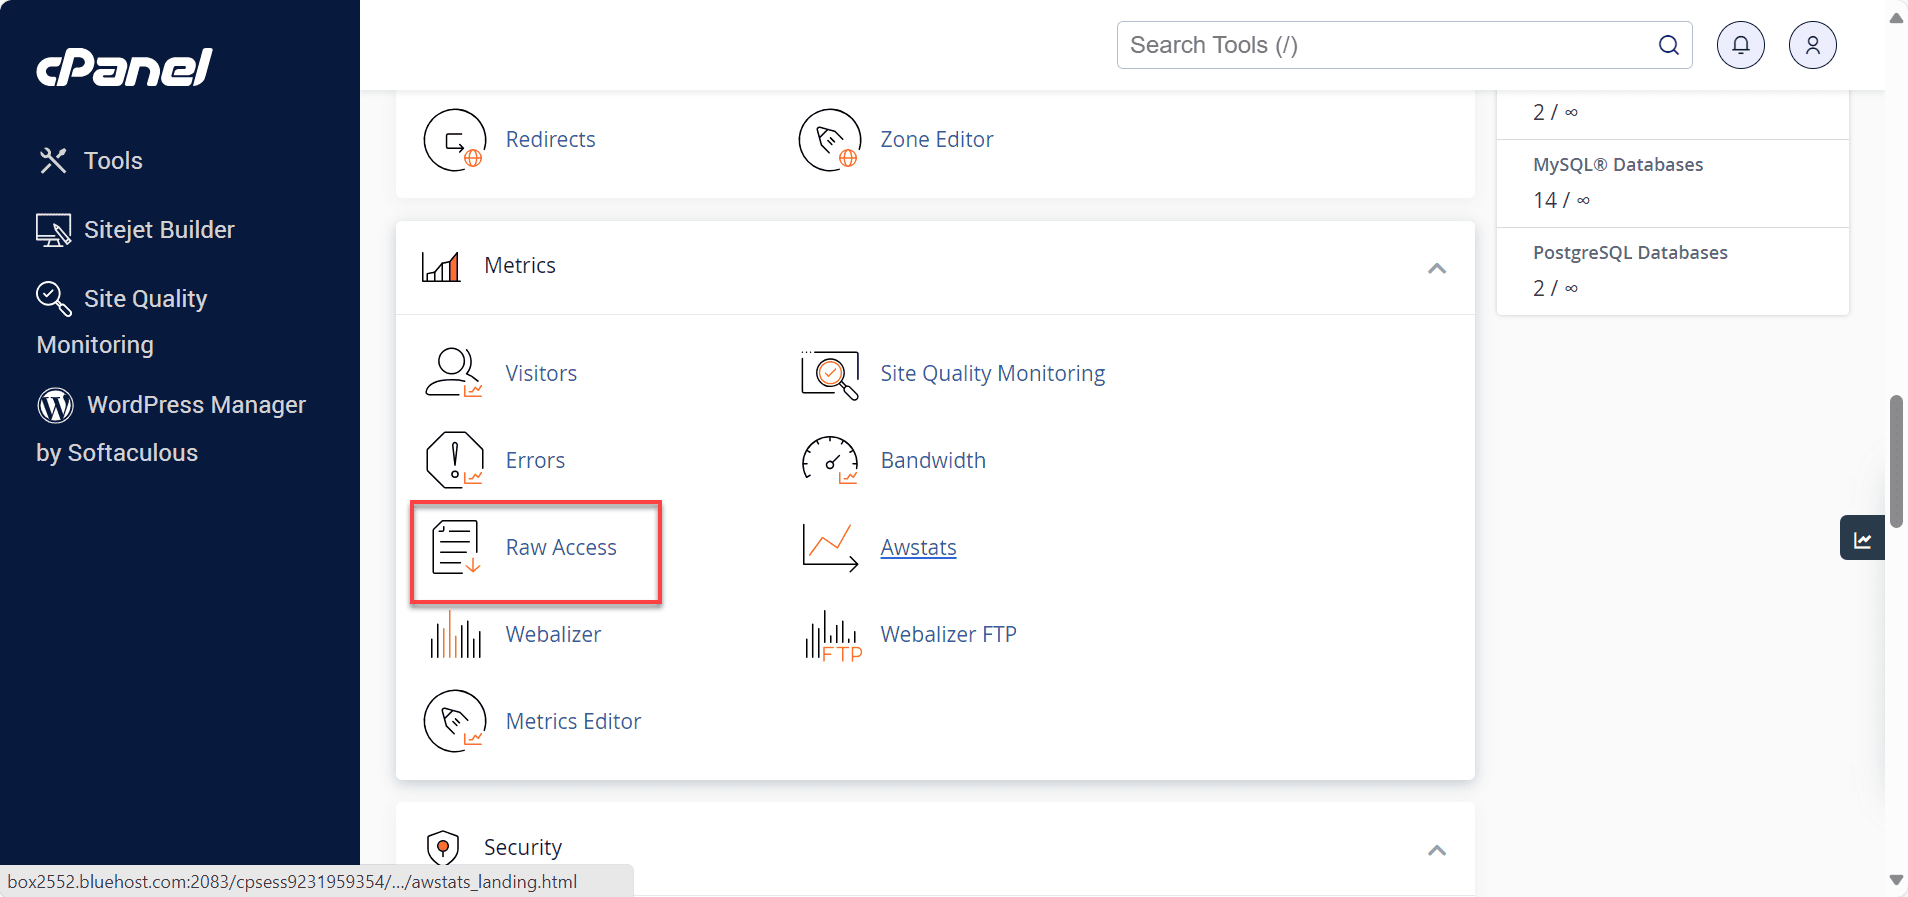
5. You will be redirected to the cPanel Dashboard. Once there, scroll to the Metrics section and click on Raw Access.
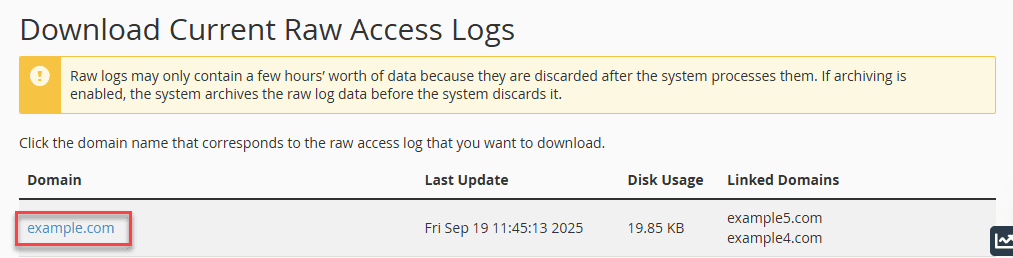
6. Under the Download Current Raw Access Logs header, click on the specific domain or subdomain you want to analyze.
7. Locate the downloaded file on your device and unzip it. You can then open the extracted log file using a text editor to view the data.
Quick safety checklist before you download logs
- Minimize access: only staff who need logs for troubleshooting should handle them.
- Store securely: logs can reveal admin URLs, query strings and user IPs.
- Limit retention: keep only what you need for diagnosis, audits or security review.
Once you’ve reviewed the basics of downloading and securing your logs, it’s helpful to understand the broader settings that control how cPanel stores and manages this data over time.
How the log configuration works in cPanel
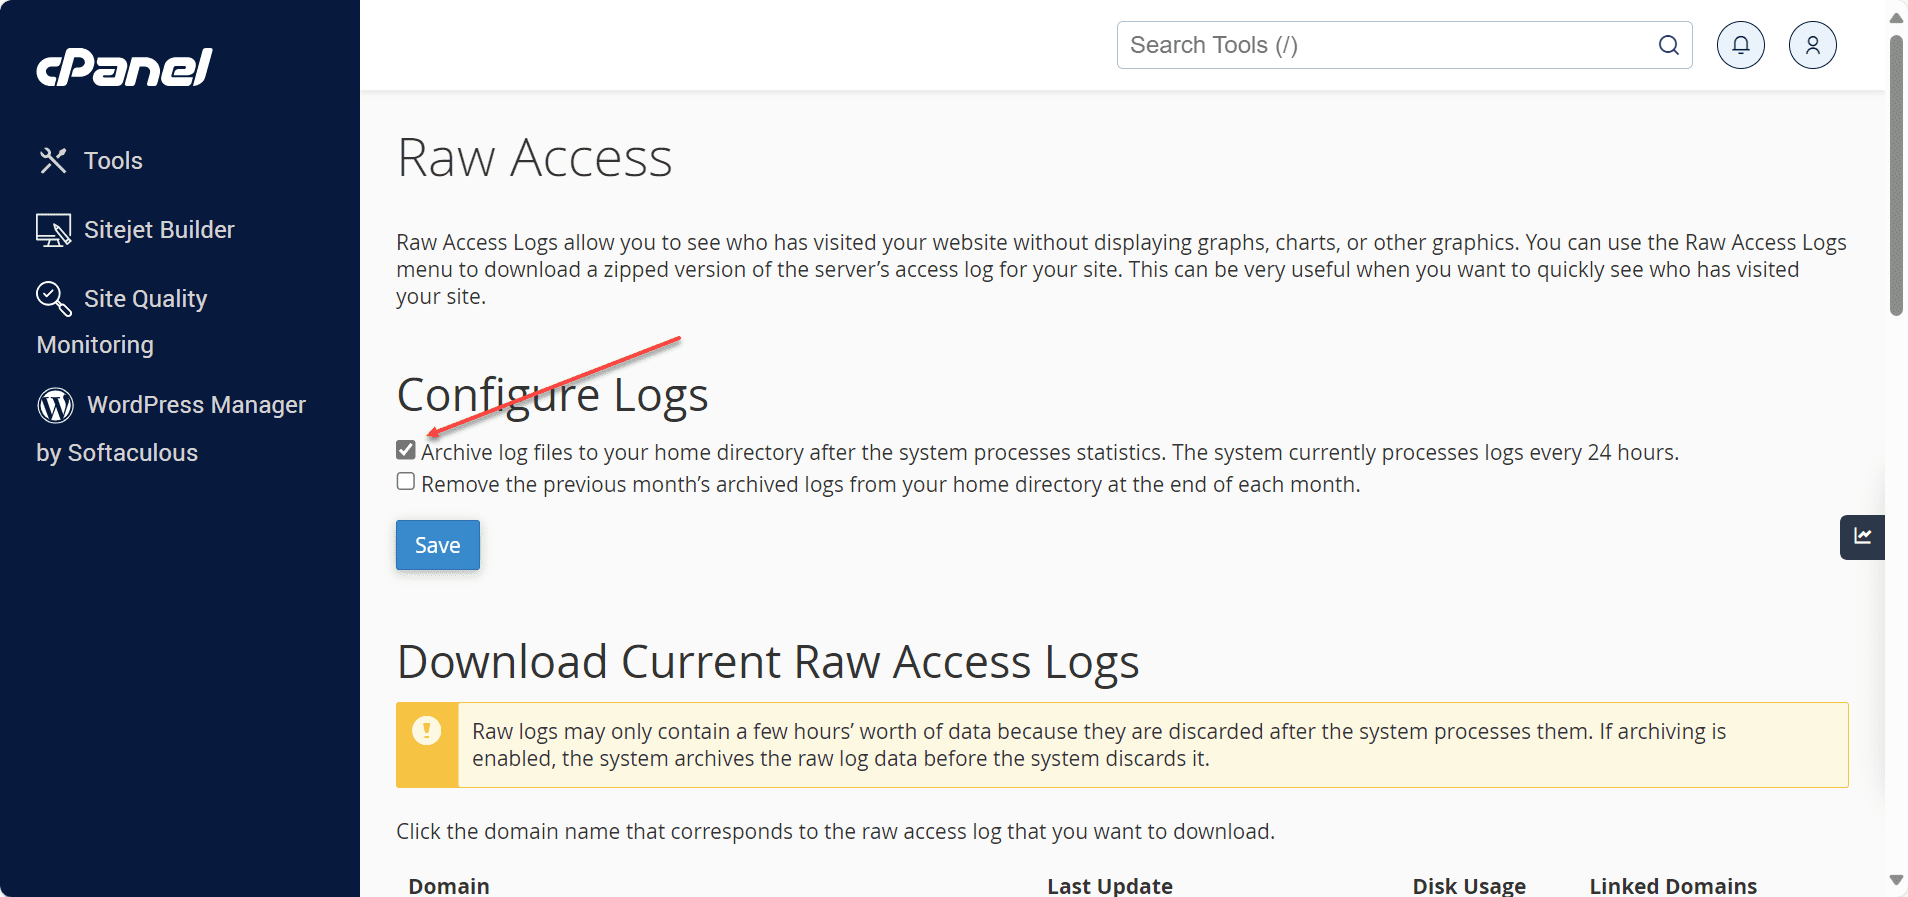
The Configure Logs section allows you to archive cPanel raw access logs automatically. You can also configure the system to delete old logs at a specified time to manage your storage space.
1. Select the first checkbox to compress and archive log files to your home directory (/home/username/logs) after the system processes your website statistics. By default, the system processes these statistics every 24 hours.
2. Select the second checkbox to remove the logs from the previous month at the end of each month.
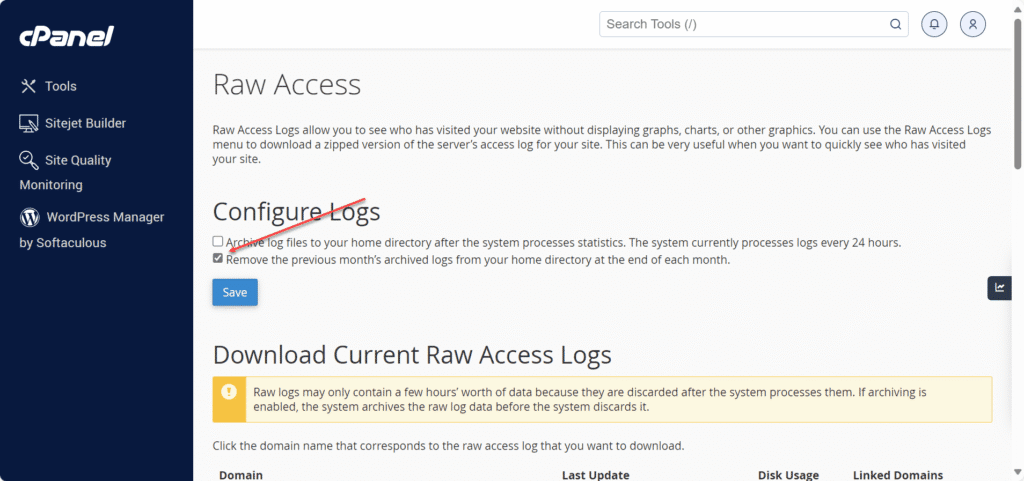
3. Save your configuration by clicking Save.
Once you’ve successfully downloaded and configured your cPanel raw access logs, the next step is understanding what information matters most for your website’s performance and security.
What should you look for when analyzing cPanel access logs?
Once you have downloaded and extracted the log archive, analysis becomes much more effective if you start with specific questions, such as “What files changed?” “When did error rates spike?” or “Which URLs are being targeted?”. The following patterns often identify high-value areas for immediate improvement.
1. Security checks
Review your cPanel access logs for the following indicators:
- Abnormal request volume from a single IP address or subnet, which may indicate scraping or denial-of-service attempts.
- Repeated access attempts on sensitive endpoints, such as login pages, XML-RPC files or admin dashboards.
- Suspicious user-agents that identify as standard browsers but exhibit scanning behavior.
- Status code anomalies, particularly spikes in 401/403 (access denied) or 500/502/503 (server errors or misconfigurations).
Actionable next steps: If you identify malicious patterns, consider implementing rate limiting, enabling a Web Application Firewall (WAF), strengthening authentication or blocking abusive IPs at the firewall level to reduce server load.
2. SEO & performance insights
Use access logs to validate technical SEO health and site performance:
- Crawler validation: Confirm that Googlebot and other search crawlers receive a 200 OK status for key pages rather than getting trapped in redirect loops.
- Performance bottlenecks: While standard access logs may not show response times, frequent retries or 5xx errors often correlate with slow-loading pages.
- Crawl budget waste: Identify inefficient crawling on URLs with tracking parameters, session filters or infinite calendar pages.
- Large asset impact: Repeated downloads of heavy images or media files can significantly inflate bandwidth usage and slow down the site for real users.
Common “quick wins” found in raw access logs
- Resolve high-traffic 404s by restoring missing files or implementing targeted 301 redirects.
- Minimize redirect chains by updating internal links to point directly to the final destination URL.
- Block non-compliant bots that disregard robots.txt directives to save resources.
- Verify sitemap health by monitoring requests to /sitemap.xml and ensuring the server returns valid status codes.
Tools to analyze logs faster
Raw logs are essentially plain text files, which makes them incredibly detailed but also potentially overwhelming. To make sense of the data efficiently, choose the right tool based on your technical comfort level and the size of the log file.
1. Fast command-line options (recommended for large files)
- zgrep: Search directly inside compressed .gz log files without needing to extract them first.
- grep: Filter lines by specific status codes (e.g., “ 404 ”) or by URL paths to isolate specific issues.
- awk: Powerful for summarizing data, such as listing the top requested pages or the most frequent visitor IP addresses.
- sort | uniq: Combine these commands to count repeated patterns, such as multiple scan attempts against the same endpoint.
Example analysis workflow: First, identify the top 404 error URLs. Next, find the referrers (sources) linking to those missing pages. Finally, decide on an action: redirect the URL, fix the broken internal link or block the abusive source IP.
2. GUI log analyzers for reporting
- GoAccess: A terminal-based tool that generates interactive visual reports, perfect for creating quick, readable dashboards from raw data.
- Spreadsheet pivot tables: Tools like Microsoft Excel or Google Sheets work well for smaller datasets if you parse the log fields into columns first.
- Security tools: SIEM (Security Information and Event Management) dashboards can automatically ingest and visualize logs to highlight security threats.
3. Viewing logs on different devices (Android and beyond)
Sometimes you may need to check a log file quickly while away from your main workstation. Here is how to handle logs on different platforms:
- Opening .log files on Android: Use a dedicated text editor app designed to handle large files. However, for very large logs, it is safer to view them on a desktop or laptop to avoid freezing your mobile device.
- Linux system logs: If you are troubleshooting a VPS or server via command line, you might encounter commands like journalctl. Remember that these check system-wide services (systemd), which are different from your website’s cPanel access logs.
- Desktop environment logs: You might see search results for terms like waybar logs. These typically refer to Linux desktop interface troubleshooting (specifically for the Wayland display protocol) and are unrelated to your web server’s traffic logs.
- Multilingual searches: In Japanese contexts, you may see terms like アクセス raw (Access raw). This refers to the same “Raw Access” feature in cPanel and the underlying analysis workflow remains identical regardless of the interface language.
What are the best practices for handling, privacy and retention?
As noted in cPanel raw access logs documentation, these records frequently contain personally identifiable information (PII), such as IP addresses and sensitive system paths like admin URLs or query strings. Consequently, you should always treat them as confidential operational data.
- Protect and redact data: Avoid sharing raw logs publicly. If you must provide logs to a contractor or support team, limit the data to the relevant time window and mask sensitive fields where feasible.
- Establish a retention policy: Configure your logs to be retained only as long as necessary for debugging and security investigations. Avoid keeping them indefinitely to save disk space and reduce privacy risks.
- Apply the principle of least privilege: Restrict permissions to ensure that only authorized personnel can access or download logs from cPanel.
- Coordinate with CDN and WAF logging: If you use a proxy service (such as a CDN or Web Application Firewall), verify whether the logs record the visitor’s actual IP address or the proxy’s IP. You may need to configure your server to log the
X-Forwarded-Forheader for accuracy.
Final thoughts
Access logs provide valuable insights into your website’s performance, security and visitor behavior. By regularly reviewing your cPanel access logs, you can quickly spot unusual activity, troubleshoot errors and understand how search engines interact with your site. What once seemed like mysterious issues become clear, actionable data points that help you maintain a healthy, secure website.
Next steps: download the latest log archive from cPanel Raw Access, scan for spikes in 4045xx responses, confirm bot activity for key pages and create a short remediation plan (redirects, blocked paths, performance fixes or security hardening).
FAQs
In cPanel, go to Metrics → Raw Access, download the log archive for your domain, extract it on your computer and open the resulting .log file in a text editor or log analyzer. This method is the most common way to view a cPanel access log without server-level access.
Raw access is a cPanel feature that lets you download your website’s access logs in a raw, line-by-line format (often compressed). It is designed for troubleshooting and analysis rather than real-time viewing.
The simplest approach is to use cPanel’s Raw Access interface. If you also have SSH and permissions, logs may be available in an account-level directory (commonly an access-logs folder) or in server-level Apache log paths, depending on the host.
The cPanel logs location depends on your hosting setup and permissions. Many shared hosting environments expose logs through the Raw Access downloader rather than allowing direct browsing of server log directories. If you need an exact path for your account, check your host’s cPanel raw access logs documentation or ask support for the storageretention policy on your plan.


Write A Comment